AllData-NI Screenshots
I've created this new page for those who wish to see what AllData looks like before downloading the spreadsheet. Hopefully, the following screenshots with descriptions, will encourage new visitors, to the site, to download AllData and start enjoying and creating their own "personal" handicapping software.
So, check out the screenshots and descriptions and then proceed with downloading the spreadsheet.
So, check out the screenshots and descriptions and then proceed with downloading the spreadsheet.
The "Main" Worksheet
The 1st screenshot shows the "Main" worksheet, where the user lists the data files and results files in his/her data and results folders. He/she can also select whether to use the "Daily play" feature or load a previous racecard, with or without results.
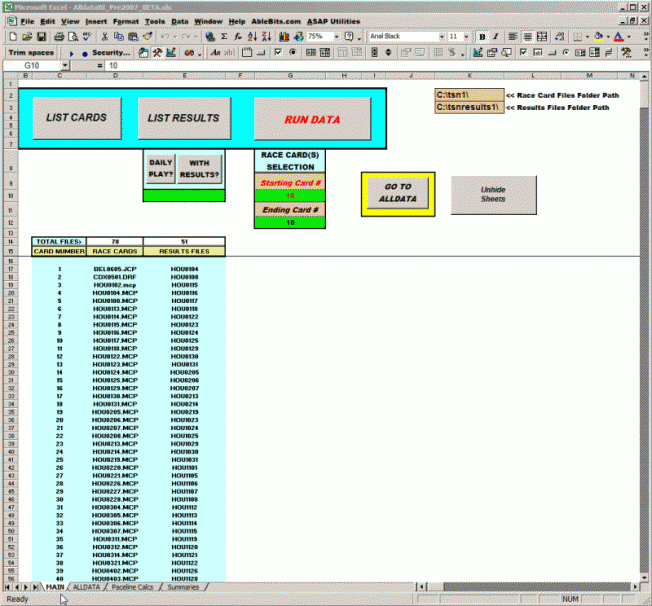
- The 2 file paths, located in cells K2 and K3, list the file paths for your personal race card past performances data folder and race card results folder.
- The "List Cards" and "List Results" buttons list all the race cards and results files in the 2 folders, on your computer, mentioned above. These listings appear starting in cells D17 and E17.
- The "Daily Play?" button allows you to load a single race card past performance data file into AllData for daily handicapping.
- The "With Results?" button allows you to load a previous single race card past performance data file and that race card's results file into AllData.
- The "Starting Card #" button tells AllData which race card/results file to load first.
- The "Ending Card #" button tells AllData if you're loading a single race card/results or multiple race cards/results, for use in historical research via the future AllData database.
- The "Run Data" button loads the selected race cards/results files into AllData.
- The "Go To AllData" button takes you to the "AllData" worksheet and navigates to the "Current Race Card Information and "Race Selection" area of the spreadsheet.
The "AllData" worksheet
After clicking the "Go To AllData" button, on the "Main" worksheet, the user is brought to the following area of the spreadsheet.
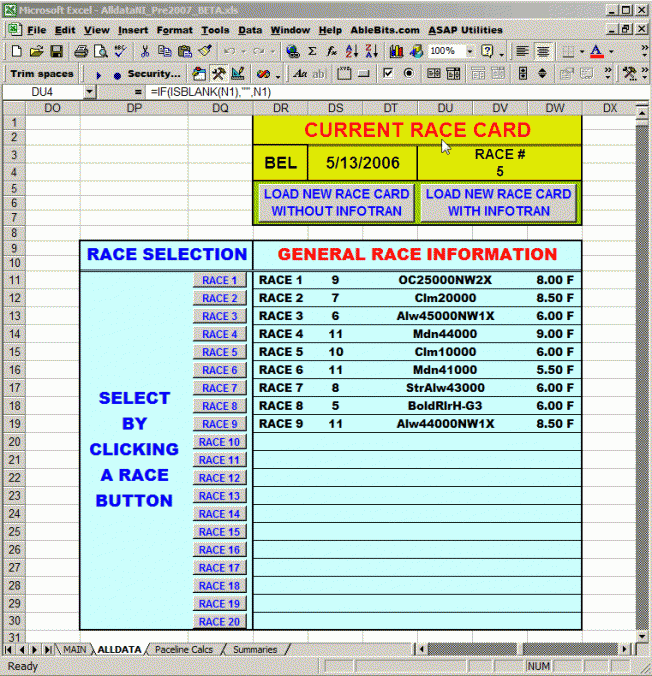
- The "Current Race Card" is displayed in the 3 cell ranges directly below it. The information includes the track code, race date, and race number selected for viewing.
- The "Load New Race Card Without Infotran" button takes you back to the "Main" page, for selecting a different race card.
- The "Load New Race Card With Infotran" button allows the user to use the free utility "Infotran" to load a new race card. This feature was the standard card loading mechanism prior to the release of "AllData NI Beta" and is for beta testing purposes. Once beta testing is completed and final release of AllData NI is accomplished, this button will be removed from the spreadsheet.
- The "Race Selection"/ "General Race Information" areas allow the user to select which race, on the current card, he/she wishes to view. Race selection is accomplished by clicking the appropriate race # button. Basic race information, for each race on the card, is shown directly to the right of each race # button. This information includes race number, number of horses entered in the race, class of the race, and distance, in furlongs, of the race.
Once a "Race #" button is clicked the user is taken to the "Past Performances" view of the spreadsheet, where a traditional "Daily Racing Form" style past performances view, using Brisnet's or TSN's data, is displayed.
The "Past Performances" View
Upon clicking one of the "Race#" buttons, in the Race Selection area, above, the user is taken to the "Past Performances" view, of AllData. Here he/she is presented a traditional DRF (Daily Racing Form" type past performances layout incorporating Brisnet's/TSN's data, instead of DRF's data.
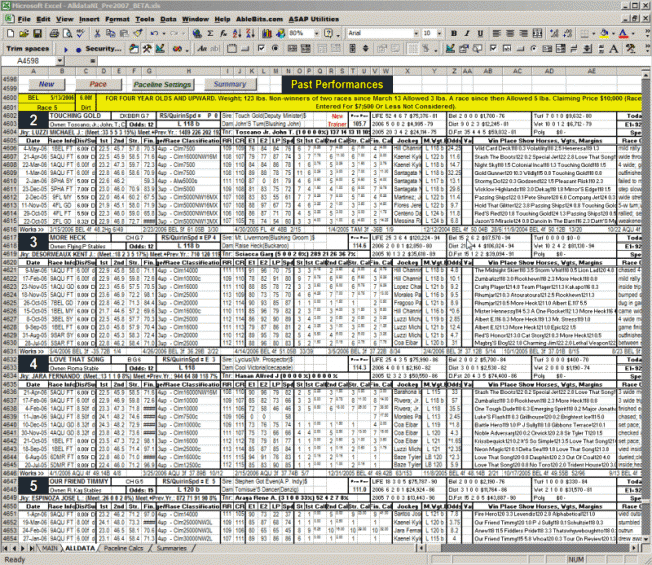
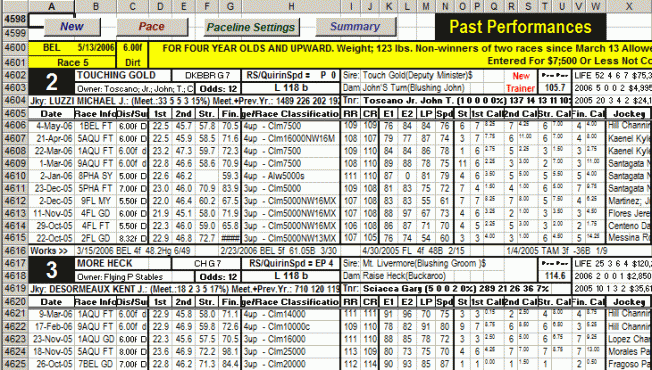
- The horses are listed in "post position" order.
- The yellow highlighted area contains today's general race information.
- There are some enhancements I made to what, otherwise, is a layout similar to the DRF publication. Note the red lettered entry for the 2 horse that says "New Trainer". This results from the spreadsheet looking at today's trainer's name compared to the trainer's name for it's last race. Brisnet's "Prime Power" ratings are also listed for each horse to the right of that previously mentioned "New Trainer" notation.
- The view lists up to 10 pacelines (previous races) for each horse, and, below those are the horse's last 7 workouts.
- The "New" button (actually when viewed at a larger zoom setting the button says "New Race"), top left, takes you back to the "Race Selection" area for selecting another race to view.
- The "Pace" button (it actually says "Pace Ratings" in a larger zoom setting), takes you to the "Pace Ratings" view, which contains "Sartin" type velocities for each horse. The next screenshot describes this view.
- The "Paceline Settings" button takes the user to an area where he/she can change the settings that the spreadsheet uses to select pacelines for use with the "Summary" view, which will be described further down this page.
- The "Summary" button takes the user to the "Summary View", where only the selected paceline data is listed, for each horse. See the screenshot for the "Summary View" for explanations of what this view presents.
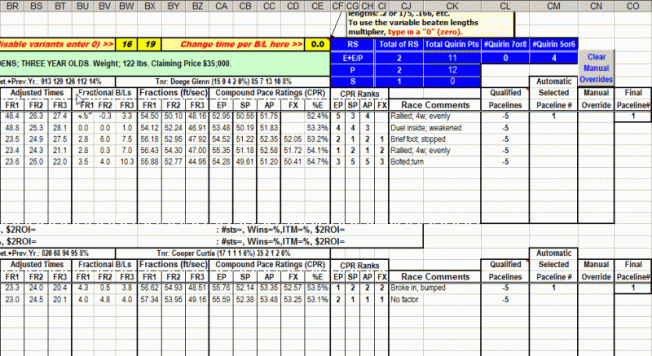
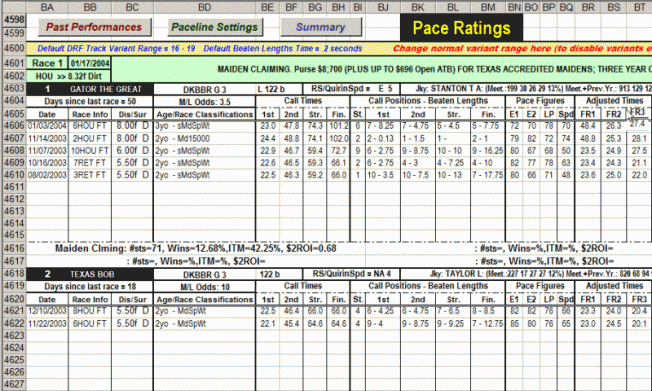
The "Pace Ratings" View
The Pace Ratings view presents the user with another way of looking at the horses. It utilizes "Sartin" type velocities for measuring the horses' calls, rather than times. These velocities are shown in "feet per second", and measures the average speed the horse ran, for each of the 3 segments of the race.
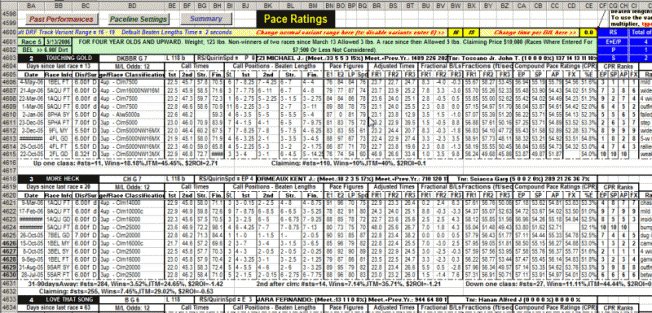
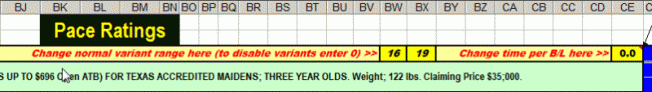
The above screenshot shows how AllData allows the user to do some things that the average handicapper doesn't do. Most handicappers do not use a track variant for anything other than to get a vague idea of how fast or slow the track surface was for a past race. AllData utilizes the Daily Racing Form's track variant to help adjust call times and final times. But, the track variant, supplied by Brisnet in it's data files, isn't used as it is supplied. For example, a track variant of 22 is not really 22. AllData allows the user to specify a range of variants that describes what is "normal" for a particular track, and then determines how much the track, fast or slow, differs from what is "normal". In the screenshot, in cells BW4600 and BX4600, there are 2 numbers entered, 16 and 19. This means that if the track variant falls within this range of 16 through 19, then no adjustment will be made to the call and final times, with the daily track variant. If the variant was 15 then the track is considered 1 point fast (or 1 length fast), for that race. Likewise, if the variant was 20 then the track was 1 point slow, for that race. In both of these scenarios, where the variant fell outside of "normal", the call and final times are adjusted by the number of points (lengths) faster or slower than normal.
Of course, the user can decide to not use the track variant, at all, by typing zeros in cells BW4600 and BX4600. The user can use his/her own "normal" ranges, by simply typing different numbers in those 2 cells.
In cell CE4600, the user can enter a "time per beaten length" (known as a "static" multiplier). The age old standard "static" multiplier of 1/5 second per beaten length has been, and, for some, still is the standard "time per beaten length", no matter what the distance run was or how fast the pace was. I won't go into too much detail concerning why "static" multipliers are not correct, other than to say that a beaten length is a distance, and the amount of time it takes for a horse to run that distance is dependent on how fast the horse is traveling. However, if the user wants to use a "static" length multiplier to adjust the call and final times, then all he/she has to do is type that "static" time per beaten length in cell CE4600.
If the user wants to use what I am convinced is a better, more accurate, method of adjusting for beaten lengths, then he/she should type a zero in cell CE4600. In doing so, the user chooses to use my "variable beaten lengths multiplier" method. This "variable beaten lengths multiplier" is calculated by determining the call leader's average speed (velocity) for each of the 3 segments of a race. The average speed of the leader is used to determine how much time it took to travel 1 length (I use 9' as an average horse length). Then this " time per length" is used to adjust the call and final times so that now we have the call and final times of the horse in question, not the leader's or winner's times.
Adjusting the leader's and winner's times is crucial because we must determine the horse in question's actual times, in order to develop it's fractional speeds (velocities), which are displayed in the "Pace ratings" view. It's easier to visualize how a horse ran a race by seeing "speeds", rather than "times".
- The "Past Performances" button takes the user back to the "Past Performances" view.
- The "Paceline Settings" button takes the user to the area of the spreadsheet where user paceline selection settings are recorded, for the automated paceline selection method, which will be discussed later.
- The "Summary" button takes the user to the "Summary Past Performances" and "Summary Pace Ratings" view, which will be discussed later.
- In this screenshot you will notice that much of the data displayed is the same as in the "Past Performances" view, but, notice that in cell BR4606 through cell BT4615 are the adjusted times for horse #1, for each of his past races (pacelines). Also, instead of seeing workout data on rows 4616 and 4617, you will see trainer moves and statistics for this horse.